Project Overview
The client
PhagoFlux builds devices that measure autophagy: the process cells use to clear out and recycle harmful material. They measure autophagic flux, the rate at which that clean-up happens. It matters because weak autophagy is linked to faster ageing and to diabetes, cancer and Alzheimer's disease. PhagoSense is their benchtop research device. It analyses cell lysates, tissue lysates and blood, runs 16 samples at a time, and returns results in about 40 minutes.
The project
UI/UX design for the PhagoSense desktop software (the application that the researchers use to run their experiments on the device and then analyse what the device finds). The scope included information architecture, interface design across several experimental workflows, and a design system to preserve consistency as the product grows.
The situation
The science wasn't the issue. The tools around the science were. This is a field where people constantly work with complex, non-intuitive software. Every minute you spend trying to work out an interface is a minute you're not spending on the experiment. For a platform like PhagoSense, that friction is real and slows research down.
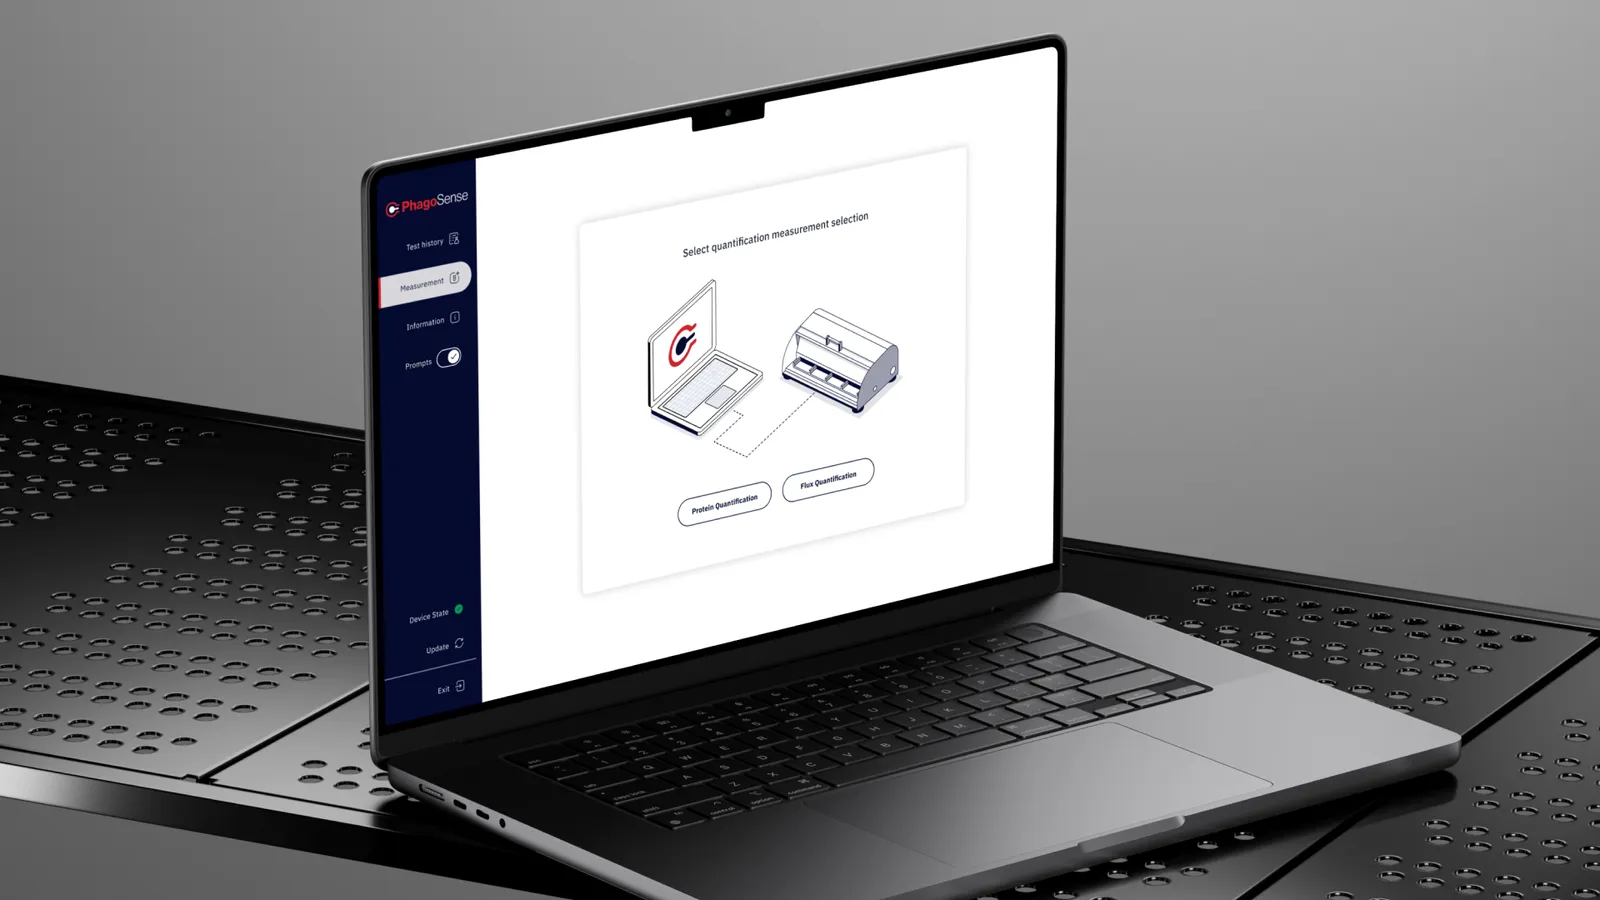
The Brief and the Main Challenge
The brief was for four things: an interface that walks you through the complicated processes; a premium experience which in no way sacrifices the scientific rigour; clear routes for exploration and analysis of the data; and a product that works for both the novice and the expert.
The tension is in that final line. If you simplify too much then the expert researcher feels like you're hiding stuff from them. If you go the other way and expose everything then someone doing their very first flux experiment has no idea where to start. The problem wasn't about simplifying the science. The problem was about making the tool easy to use without in any way compromising the science.
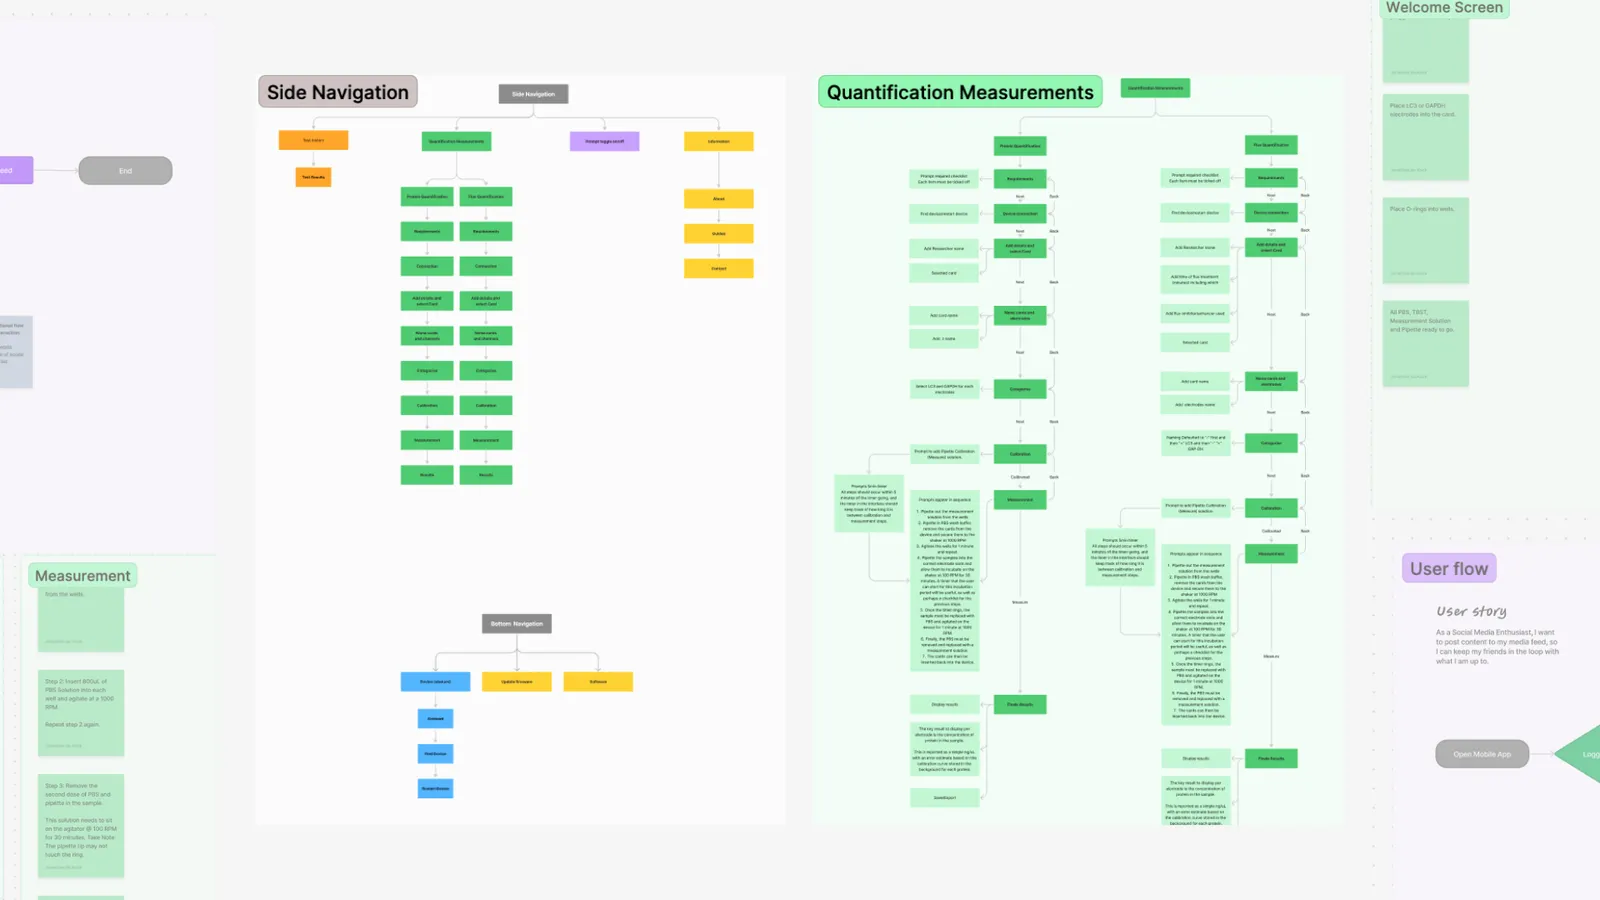
Discovery: Long Experiments, Dense Information
We started with the users. Through interviews and actually working alongside the scientists we saw how the experiments actually went and where the software was making them more difficult. Two problems came up over and over again.
The experiment is long, and the interface made it feel longer
Autophagy experiments are multi-step and time-consuming. The scientists we spoke to struggled with those long procedures: losing their place, not knowing what came next, and not knowing how far along they were. A tool that leaves a scientist asking "where am I?" in the middle of an experiment is asking them to carry the structure in their heads, on top of the science.
Too much, all at once
The second pain point was information overload. Dense scientific content arrived in one block, with no sense of what mattered now and what could wait. The issue wasn't that the information was wrong or unnecessary. Researchers need all of it eventually. They don't need it all at once.
Four problems to solve
Those findings narrowed the design work to four problems:
- Organising dense scientific information so it's accessible without being diluted.
- Creating clear paths for deep data exploration.
- Keeping the experience consistent across several different experimental workflows.
- Supporting researchers through long-running experiments.
The Strategy
Three principles shaped every decision that followed.
The interface carries the structure, so the researcher doesn't have to. If an experiment has steps, the tool should know which step you're on, what comes next, and how much is left.
Show what's needed now. Keep the rest one click away. Nothing is removed for simplicity. It's ordered, so the right information arrives at the right point in the work.
Accuracy cannot be compromised. We tested every simplification against one question: does this make the tool easier to use, or does it make the science less precise? Only the first kind made it in.
Design: The Decisions That Influenced It
1. The experiment is a sequence, so the interface is too
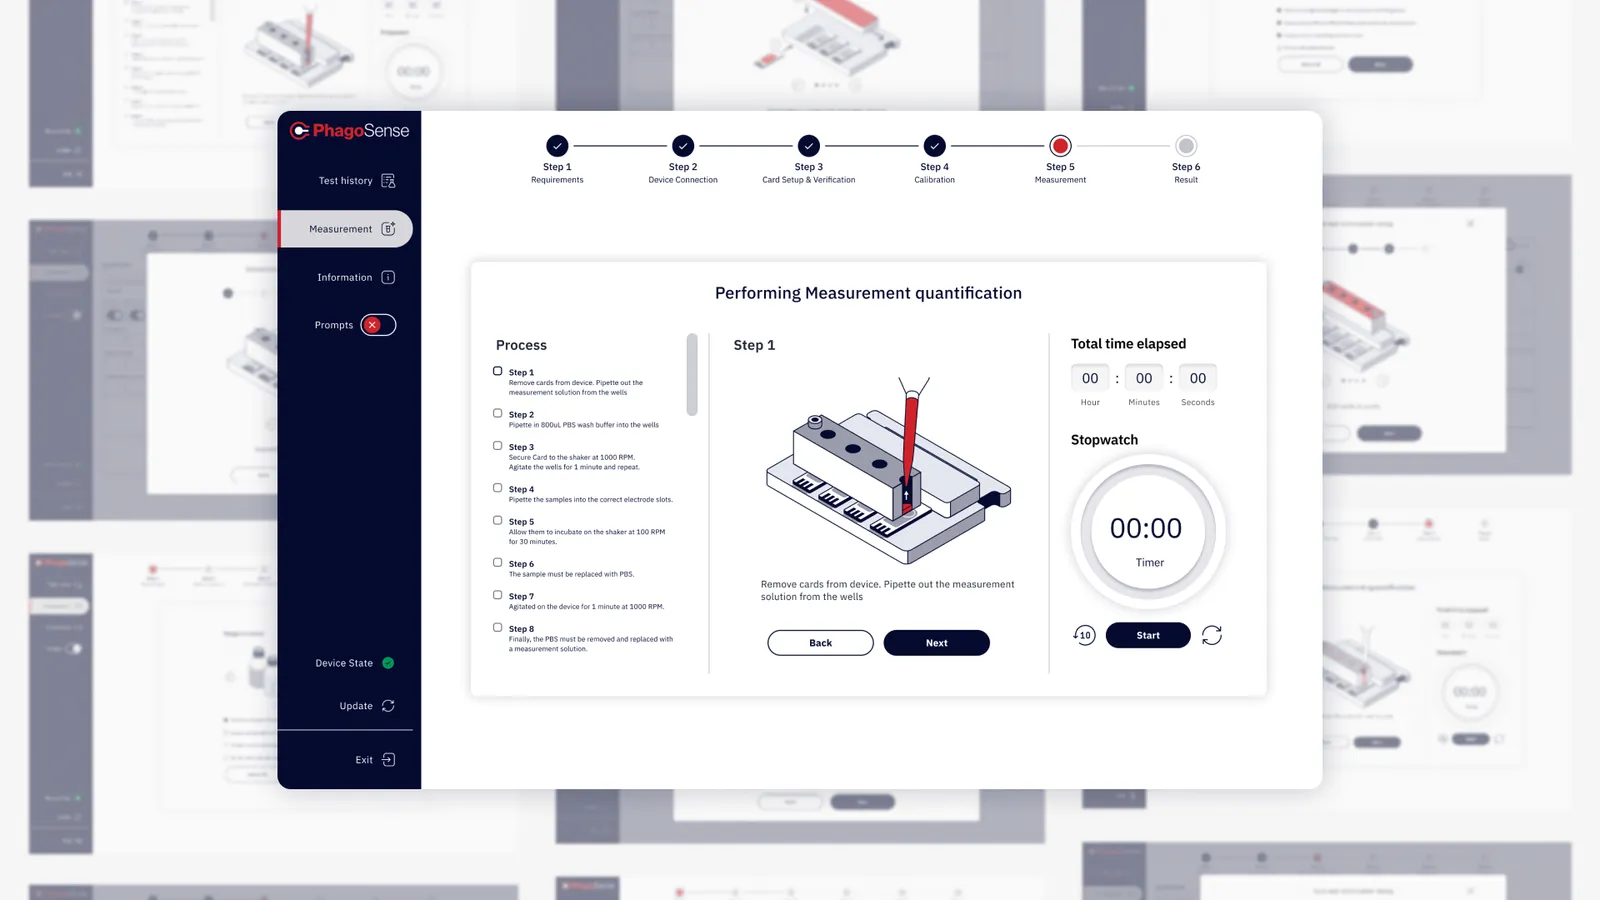
The information architecture is experiment driven rather than feature driven. Each step of the experiment is isolated with step by step instructions, visual progress indicators and breadcrumb navigation so you always know where you are and where you need to go. The same terminology and controls are used throughout which is far more important than it might initially appear. In a scientific tool if a label changes from screen to screen you end up with people wondering whether the thing it's describing has changed as well.
2. Reveal complexity when it's asked for
Dense content is delivered via progressive disclosure (the core content first, then the detail one level down). The new user can follow the path that's laid out for them. The expert user can go straight to what they need. There's an integrated help system and live feedback as part of the workflow so support is available in context rather than in a separate manual. It's one interface for both, not two modes to switch between.
3. The data is the destination
All that guidance exists to get researchers to what they actually care about: the results. Custom data visualisation tools and interactive analysis let them explore their findings in the platform. Results export in multiple formats with full reporting, because research doesn't end in the tool. It ends in a paper, a presentation or a lab meeting.
The look
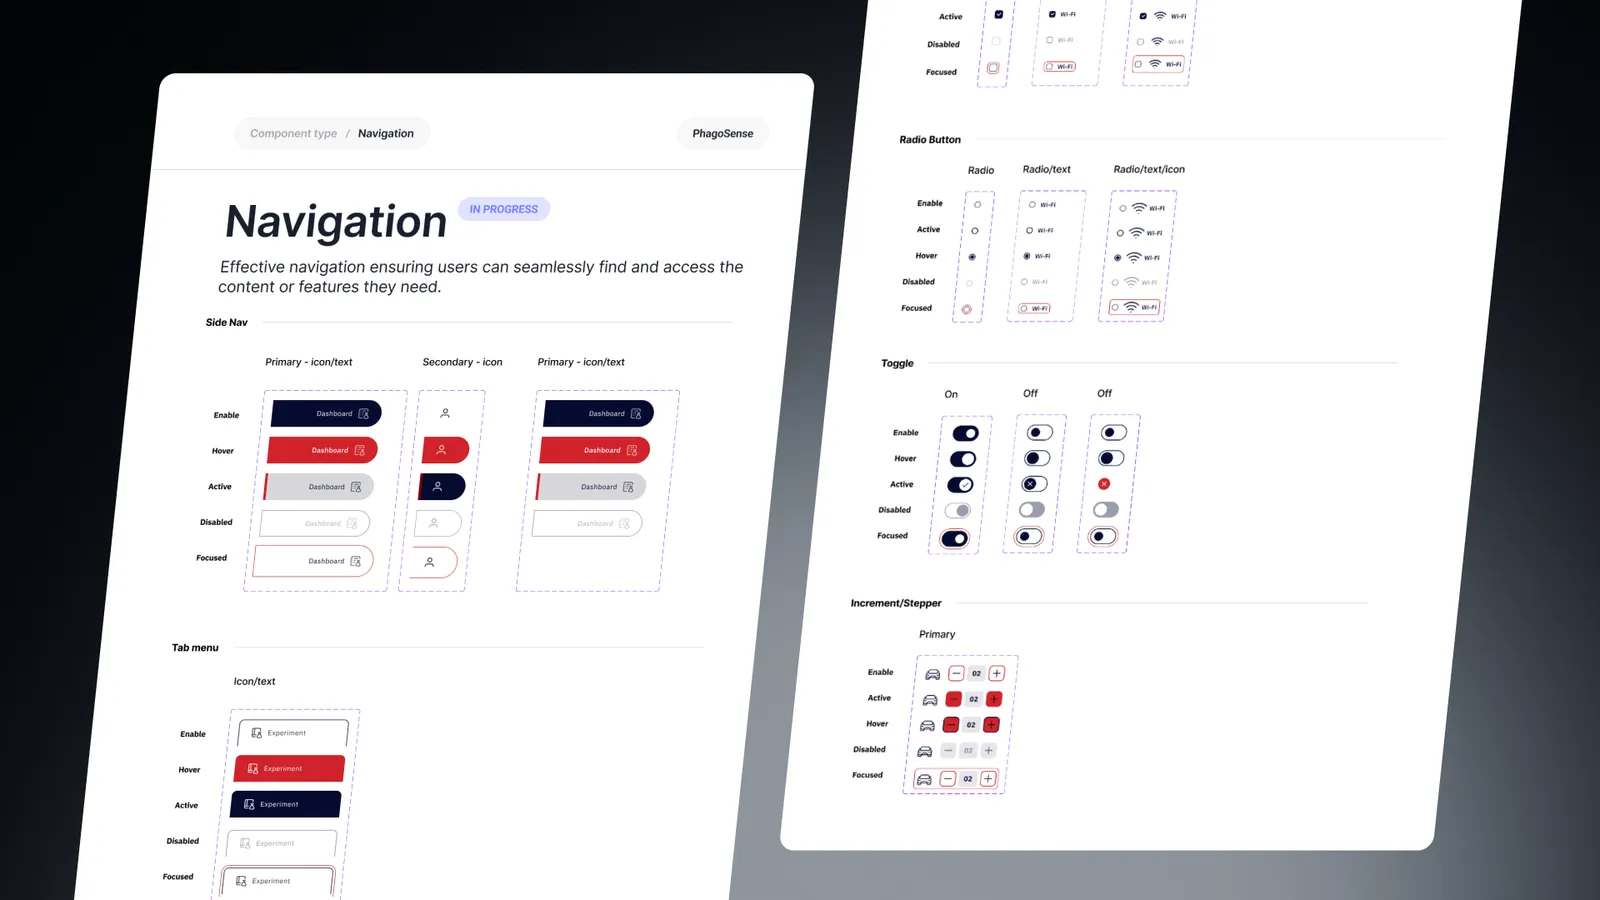
The colour palette is deliberately clean and minimal. In a data tool, colour carries meaning in the charts, so the interface around them can't afford to spend it on decoration. A systematic typography hierarchy does the organising work instead. Standardised UI patterns and consistent inputs keep the experience predictable across every workflow, and give the product room to grow without the design fragmenting. Isometric illustrations add context to the harder concepts, explaining what's happening in the experiment where a paragraph of text would only add to the load.
The Results
The new interface improved the measures it was designed to move:
- Engagement and completion. Researchers engaged more with the software, and more experiments were completed.
- Time on task. Complex procedures take less time to complete.
- Satisfaction. User contentment scores went up.
- Analysis. Working through the data is more efficient.
The two original pain points eased too. Step-by-step guidance and progress indicators reduced difficulty during long experiments. Progressive disclosure meant researchers kept more of the information they needed, with less mental effort.
What We Learned
Experts don't want less guidance. They want guidance they can skip.
It's easy to think that novices and experts need different products. In reality, both benefit from a clear structure. The only difference is that experts move through it faster. Designing guidance that steps aside once you know the route is simpler than building separate paths for each group.
In a data tool, restraint is a functional requirement.
A minimal palette can look purely aesthetic. Here it was practical. When colour in a chart means something, colour elsewhere in the interface competes with it. Keeping the interface quiet is what lets the data speak clearly.
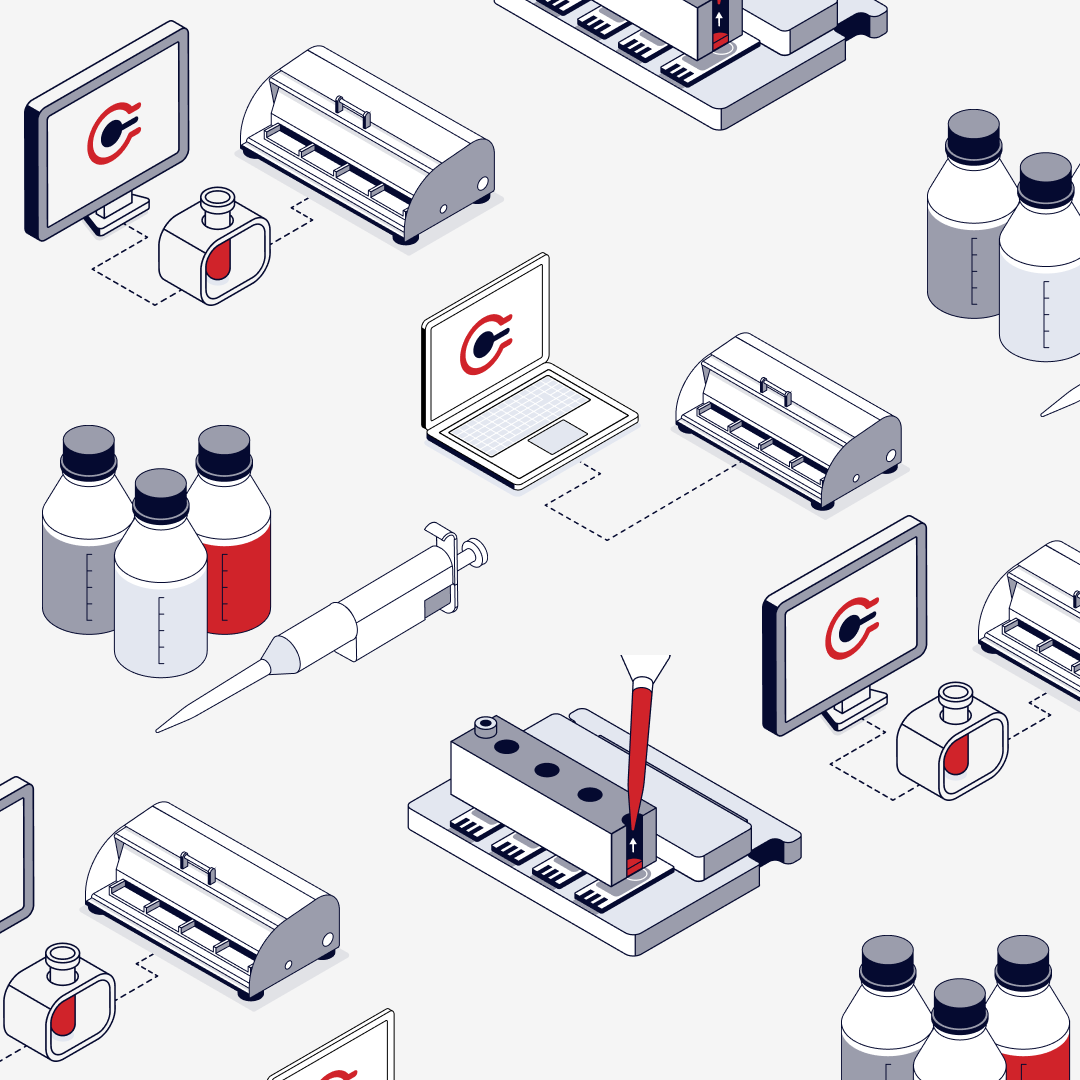
Illustration earns its place when it explains.
The isometric illustrations aren't there to decorate the product. They're there because some concepts are faster to understand in a picture than in a paragraph. That's the test we'd apply to illustration in any complex product: does it reduce the reading, or add to it?
What we'd do differently
We'd established measurable baselines prior to the design work commencing: the time it took to do key procedures, how often researchers completed experiments in the platform and how they rated the experience. The whole design was aimed at improving on all of those. Having those numbers in place from day one, the next version of this case study would be able to show the improvement.
Closing Reflection
Scientific software is often designed so that complexity proves capability. PhagoSense takes the opposite view. The science is just as rigorous, and the tool around it gets out of the way. A researcher should focus on autophagy, not on figuring out where the next button is. Good UX in this context doesn't simplify the science. It respects it.